Meet the Team
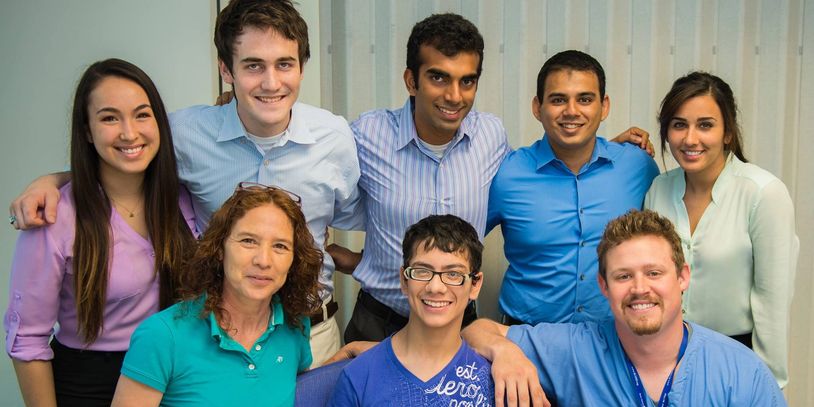
Our multidisciplinary team was comprised of two mechanical engineers, two biomedical engineers, and one electrical engineer. Pictured above is the team (top row) with a patient and the patient's mother and therapist at Shriners Hospital (bottom row).
Throughout the project, I served as the hardware and testing apparatus design lead to ensure our solution was engaging, safe, and easy to use for the patients.
Initial Brainstorming
The Functional Dexterity Test
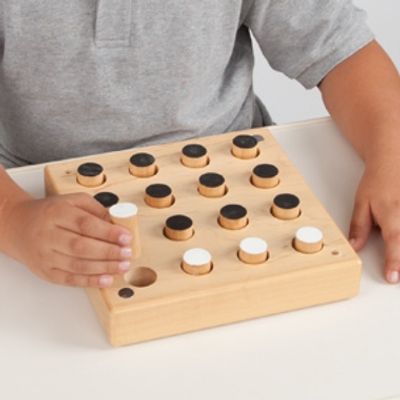
At the start of the project, we sat down with various medical professionals to understand the methods they used to try and measure the range of dexterity of their patients. We found that some would simply have patients pick up and move objects from one location to another, while others used the functional dexterity test (FDT), a qualitative test requiring patients to pick up, turn, and place a series of pegs into a board with one hand.
Given the simplicity of the FDT, and the fact that the majority of current patients were already used to performing activities similar to it, we decided to base our solution off of this concept. With the FDT as our foundation, our next step was to define design criteria to be able to track and measure successful outcomes for both of our users- those that would perform the test (patients), and those that would administer the test and manage and read the results (therapists and surgeons).
Measures for Success: Design Criteria
User Friendly
In order for a wide range of medical professionals to be able to administer the test to measure dexterity, one of our primary criteria was designing our solution with the capability of being administered and understood by the patient in two minutes or less.
Accurate
Given the quantitative requirement, our solution needed to be able to measure motion within 1cm or less of the actual path to avoid data drift and false readings.
Portable
Given our solution would ideally be administered across a range of specialties, we determined our solution needed to be easily moved between locations, and require no more than one person to be able to do so.
Intuitive to Operate
In addition to being user friendly for administrators, we needed our solution to be intuitive and easy to operate. We determined a set up time of five minutes or less would be required to make the solution successful.
Time Efficient
To be successful, our solution would also need to be time efficient and have the ability to deliver data real time. We therefore decided that to be successful, our solution would need to begin displaying results within the first 5 seconds of testing
Ideation and creation
Evaluating Existing Motion Tracking Software
To understand existing motion tracking solutions, we analyzed a range of sensor based technology, such as Xsens MVN BIOMECH, Gait Smart, and even Xbox Kinect, that are configurated to capture human movement.
We learned that while inertial sensors, electromyographic (EMG) sensors, and even IR depth sensors were used across these solutions, they all required specialized motion capture cameras to analyze the results. Not only were these cameras extremely expensive, but they had to be wired and fixed within a specific space and frame of reference, meaning the solutions were not portable, and as a result unsuitable for the purposes of our project.
Selecting Motion Tracking Software
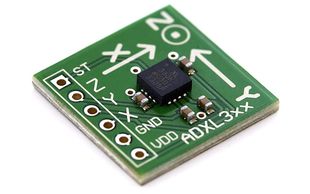
Further research into technologies that had the ability to track motion led us to use smartphones as the best use case. With the help of Texas Instruments, we identified that the majority of smartphones used axis based motion sensing components to measure acceleration and relative orientation.
Given that these components came in a variety of sizes and were able to be configured wirelessly, we chose accelerometers, which measure speed, and gyroscopes which measure objects rotating around an axis, as our primary motion capture methodology.
Fitting the Software to the Hardware
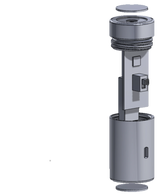
With the FDT in mind, we explored how we could leverage the small and familiar cylindrical pegs patients currently used for their motion tests. As our criteria dictated our solution be portable and intuitive, we decided to design a hollow peg where the electrical components would be housed inside (expanded view of peg above).
Thinking through this idea in further detail resulted in identifying that in addition to an accelerometer, if the solution was to be wireless we would need a way to power the device, and a way to transmit data remotely. We therefore designed the "smart" peg with an on and off switch and a screw cap, to be able to take the components in and out as necessary.
Learning to Power the Solution
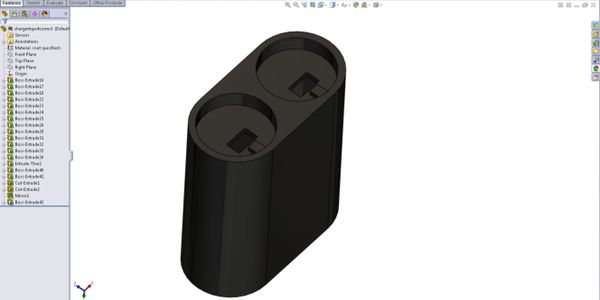
A series of options were entertained in order to power the peg. As the peg is intended to be wireless and intuitive to use, the mechanism through which the peg is recharged should also be simple. The team came up with several ideas, such as using a charging mat in which the peg would be laid flat, or through treating the peg like a rechargeable battery, creating a positive and negative terminal on each side, and connecting it in a casing to supply the voltage.
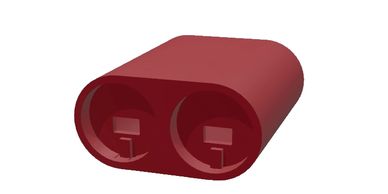
Although these alternatives could have been feasible, it was noted that these mechanisms were not standardized, and in the event that the charger malfunctioned, it would have been challenging to replace. By implementing a standard mechanism such as a microUSB, the peg would be able to have a secure and widely available connection. A final decision was made to move forward with a wall charger containing the microUSB connection given the availability and functionality of this method. A charger casing was then designed to charge two pegs at a time (pictured above).
Designing the Testing Apparatus
Now that we had thought through the technology, we needed to provide patients with a way to interact with it. After a series of patient observations, and consultations with orthopedic surgeons, it was determined that the two most important characteristics of movement were smoothness and accuracy of motion.
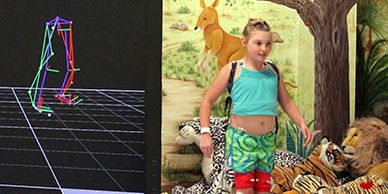
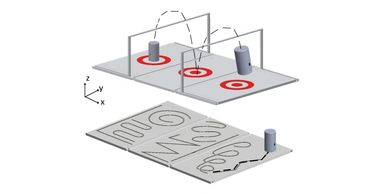
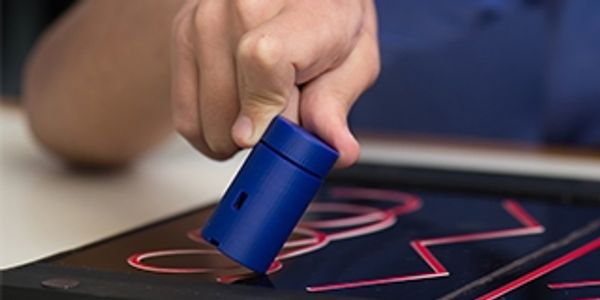
To test patients’ smoothness, one exam was designed with a series of paths of various curvature and angles for the patient to trace over with the peg. The movement of the patient is then compared to an average of ideal motions generated from a fully functional, unaffected hand to be able to provide a quantitative evaluation and track improvement over time. In order to evaluate the patient’s accuracy of motion, a second test was designed where patients are asked to rotate the peg in their hand while moving the peg over a hurdle and onto the following target.The exams were designed on two sides of a single rectangular mat that folds onto itself for ease of storage and portability.
Drafting the User Interface
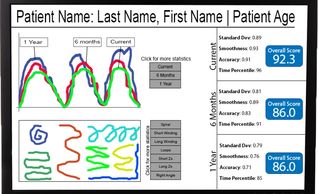
The final step in our solution was to develop a graphical user interface (GUI) as a tool for the physician to conduct data collection, analysis, and result storage.
Following research of available data visualization tools, the team decided to create a GUI in MATLAB using the GUIDE toolbox, given our familiarity with the software. The user interface was designed to display the most recent outcomes of the smoothness and accuracy test including time taken to complete the test and the standard deviation from average motion. To monitor progress, we also included a section to report historical outcomes and statistics.
Testing and Iteration
Testing Objectives
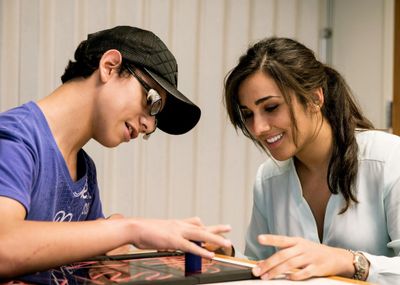
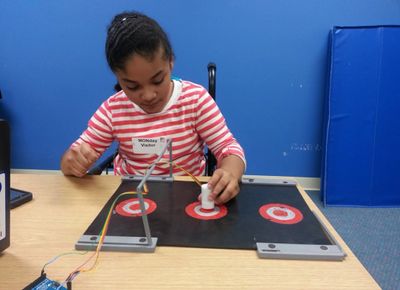
Shriners Hospital allowed us to begin testing the first iteration prototype with cerebral palsy patients once assembly was complete. The objectives of the testing were:
- Verify ease of use of the peg
- Record sample data to be analyzed and used to test metrics
- Verify usability and effectiveness of exam apparatus
- Verify ease of on-boarding for the physician and patient
Testing Insights
The testing was conducted using a microcontroller connected to a motion tracking device (MPU9150) and wired via USB to a laptop. The prototype yielded data at 36 Hz and was conducted with a neoprene rubber testing apparatus. The testing yielded several major findings that assisted us in moving towards the final iteration of the device:
- The exam apparatus material needs to be smooth enough for the peg to slide
- Patients often hit the hurdle so it must be sturdy enough not to fall
- 36 Hz is not a high enough data resolution to garner an accurate motion path
- Peg size and weight is acceptable for a diverse range of patients
- Drops must be factored into metrics as a separate occurrence to prevent skewing standard deviation models
Dexcellence: The final Solution
Overview of the Components: The Peg
The Peg
The final peg design, a 50mm x 26mm hollow cylinder joined together via a screw cap was fabricated through a 3D printing process using ABS plastic.
For commercial implementation, we recommend reformatting the final design for an injection molding process. Using this form of manufacturing will enable the cost of the product to be greatly reduced and the speed of production to be increased .
The Printed Circuit Board
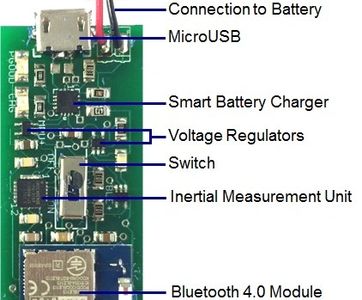
The final technology used to track movement and transfer the motion data was assembled into a printed circuit board (PCB) sized 18mm x 46mm which was ultimately housed in the peg. The final components incorporated consisted of:
- A microcontroller inertial measurement unit: MPU 9150
- A Bluetooth module to wirelessly transfer data: Bluegiga BLE113
- A Smart Battery Chip to power the PCB: TI BQ24230
- A switch to power on and off
- A MicroUSB to connect to the charger
- Two Voltage Regulators to prevent any voltage spikes from damaging the functionality of the remaining components: TI TLV70033 and the TI TPS22945
The combined power requirement of all the components in the peg yield a total battery life of about 4 hours.
The Charger
The charger is designed to be able to charge two pegs at once and is fabricated out of ABS plastic. The overall dimensions of the charger are 33 mm in width and 130mm in height. At the bottom center of the charger on the back side, it has prongs that are to be inserted into a standard U.S. electrical outlet. The top of the charger contains 10mm indentions for each peg to fit into. At the center of each indentation is a slot where a male microUSB header is secured and connects to the female connector found on the bottom of the peg. Within the charger, a PCB is housed that outputs 5V to the peg with two leads to which the microUSB connects.
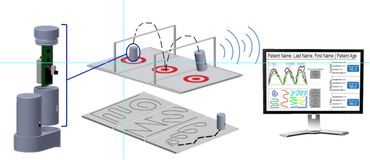
Putting it All Together
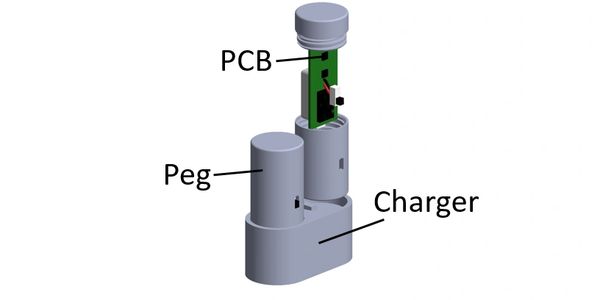
Pictured above is an assembly of all three components fitted together.
The peg is shown in an exploded view to provide users with a better sense of how the PCB fits into the design.
Two pegs are shown connected into the base of the wall charger.
Overview of the Components: the Testing Apparatus
The Accuracy Test
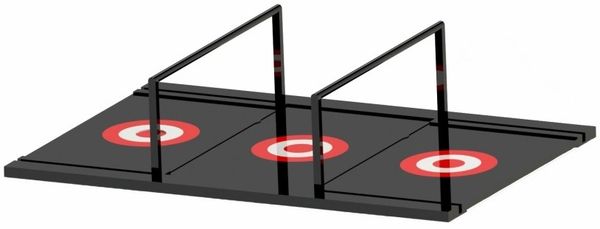
The testing apparatus is used in conjunction with the peg to execute the accuracy and smoothness test. Pictured above is the accuracy test.
The mat is 12” by 18” and made of smooth acrylic. The base material is opaque black with 1/16” insets for the three targets and all the trace paths. The targets and the trace paths are cut from a separate red acrylic that are dropped into the insets on the black acrylic. The test also contains collapsible hurdles for patients to move the peg over. As they move over the 3.5" hurdle, patients are asked to rotate the peg 180 degrees in their hand.
The Smoothness Test
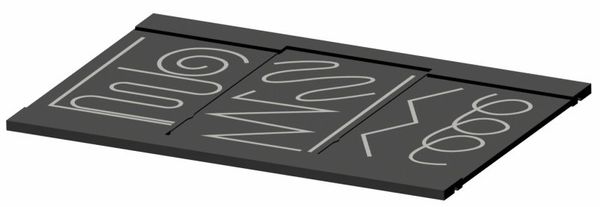
The flip side of the acrylic mat contained the smoothness test. Comprised of eight paths of different angles and curvature, the patients are instructed to trace over each path with the peg as accurately as possible. Insets were also etched into the base material for each trace path. The trace paths themselves were laser cut from a separate white acrylic.
Overview of the Components: The Graphical User Interface
Raw Data
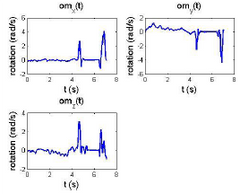
The motion capture components housed within the PCB were initially connected via mini-USB to a PC where the accompanying software was programmed in order to record and display the raw data. Four different types of exams were created to test different motions: linear, rotational, acceleration, and repeatability.
During testing, we found that drift began to occur and accrue over time. To prevent this from occuring, we added a magnetomoter, which provided added orientation of motion in relation to the earth's magnetic field.
Data Optimization
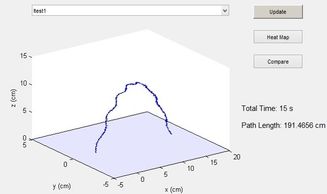
For each exam, the physical distances were compared to the motion path distances generated in the user interface. The data was loaded into a specified 3D coordinate platform to be able to read results more easily and effectively.
To optimize the data analysis code for accuracy, and further reduce drift, an Extended Kalman Filter was also applied. For a 5 second parabolic motion, the Extended Kalman Filter was able to reduce data from 10m to 1m for a 6-axis inertial measurement unit. Once the magnetometer was applied, essentially converting to a 9-axis measurement unit, the drift was further reduced to a total of 10cm.
User Display and Interface
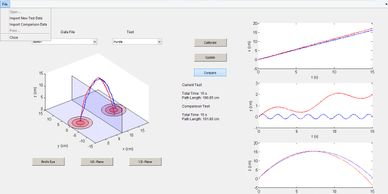
The graphical user interface (GUI) was formatted and organized for the physician to conduct data collection, analysis, and result storage. The GUI was designed in MATLAB using the GUIDE toolbox, combining the Extended Kalman Filter with code for data acquisition and presentation. The GUI is controlled by a system of buttons and drop down menus that enable the physician to specify the type of test, and compare with previous results.
Upon completion of the GUI, the program was compiled into a standalone executable program to enable it to be operated on any platform without requiring the installation of MATLAB.